Pharmaceutical tablets are the most widely used solid dosage form for the administration of drugs, accounting for around 90% of all clinically prescribed medicines. Using a new testing method developed at the Sheffield Multimodal Imaging Centre, our researchers are helping to improve their performance.
Monitoring the ingredients
A pharmaceutical tablet contains a combination of drug, known as the active pharmaceutical ingredient (API), and ‘inactive’ substances such as a polymer binder, disintegrants, flavour enhancers and pH modifiers. These substances act as the API(s) carrier and contribute to product characteristics such as stability and API release rate.1
The tablet’s performance is dependent on the size and distribution of all the components in the final product. During the manufacturing process, the size and distribution of the components can change, making these important attributes to monitor.
Current quality control tests focus on determining the uniformity and concentration of the API within the pre-tabletted powder mixture. However, these methods are destructive and don’t provide information about API distribution in the final product. This can lead to inconsistencies that affect the tablet’s performance and reproducibility.
A new method
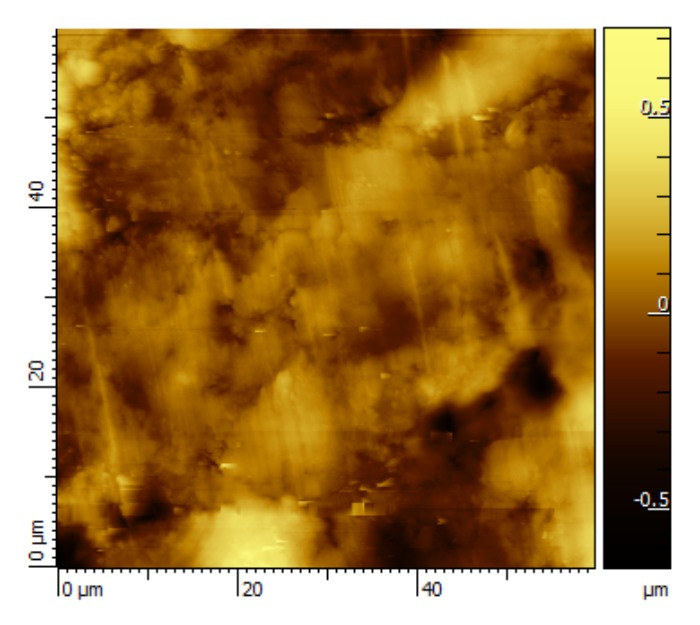
Atomic force microscopy (AFM) is a non-destructive method that enables high-resolution imaging based on the deflection of a tip at the end of a cantilever during the interaction with a surface. AFM provides detailed topographical images at sub-micron resolution with limited chemical information.
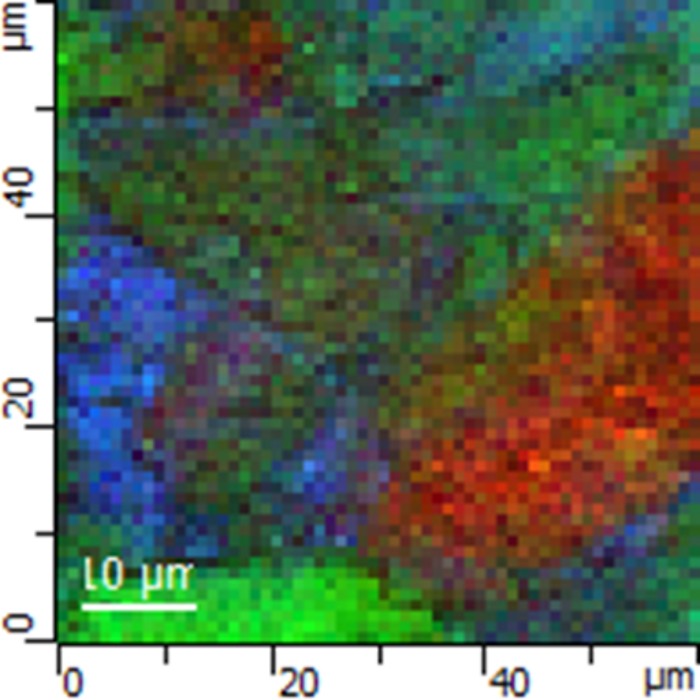
Raman spectroscopy is a non-destructive technique that provides chemical information based on the vibrations of a molecule via the inelastic scattering of a monochromatic light source, typically a laser, and has a spatial resolution in the micron range.
Combining AFM and Raman together permits both the collection of high-resolution images and chemical information from the same area of a sample surface.
AFM-Raman in action
In this example, tablets from blends of itraconazole (IT), a weak acid to modify pH and hydroxypropyl methylcellulose (HPMC), a gel forming binder to control the release rate of the API, were manufactured by direct compaction – the process by which tablets are compressed directly from powdered substances. Inconsistent distribution of either the weak acid or HPMC would lead to a variation of API release between tablets, resulting in failure to obtain regulatory approval.
Using AFM-Raman, researchers were able to determine the distribution, size and shape of the inactive substances. The AFM data provided images giving information about the domain size and morphology, while the complementary Raman maps provided chemical identification of the defined domains.